Objective:
To analyze and understand sale trends among internal products vs competitive to determining pricing, promotional, and forecasting strategies.
Process:
Pulled raw data from POS sources (Nielsen, IRI).
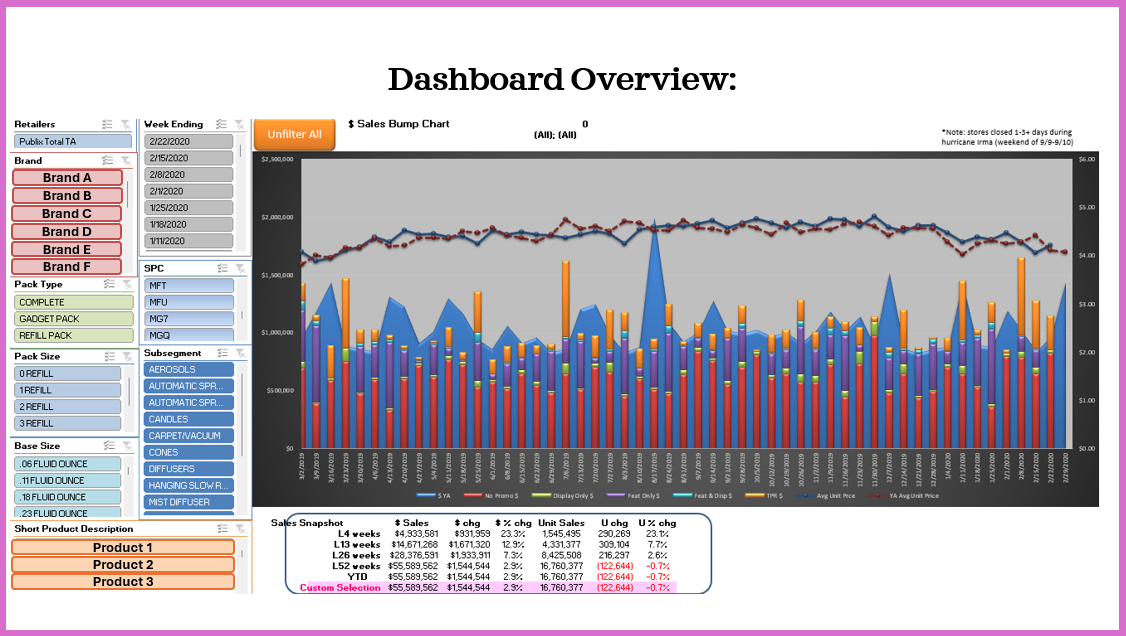
Developed data visualizations, macros, and filters in a dynamic report.
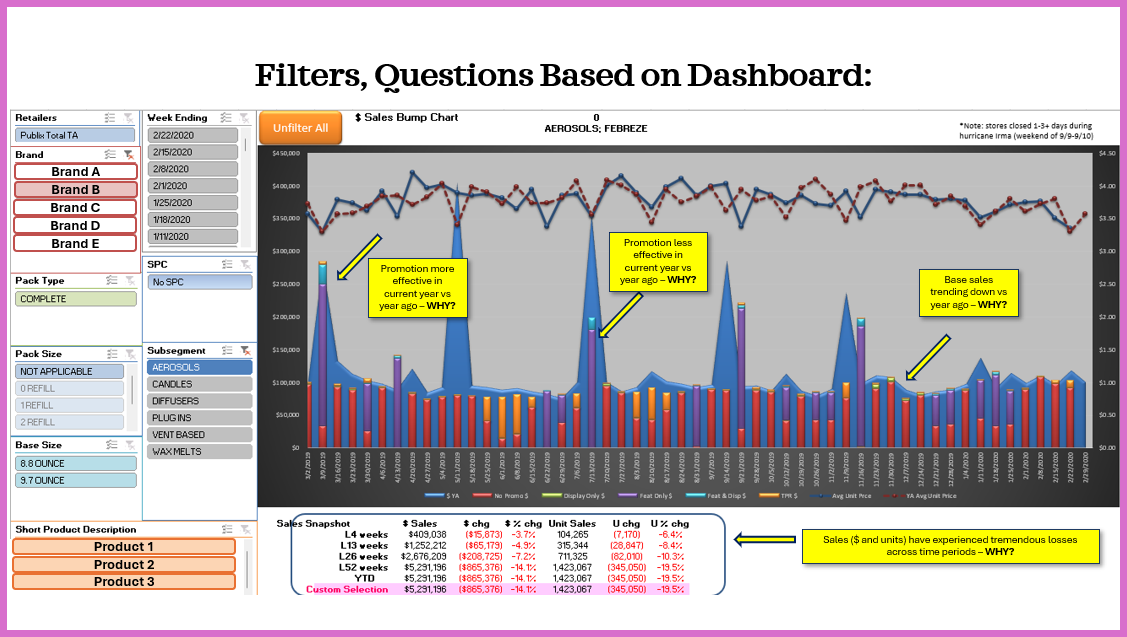
Collected and integrated data on dollar sales, unit sales, pricing, and promotional details.
Utilized bump charts to illustrate trends.
Outcome:
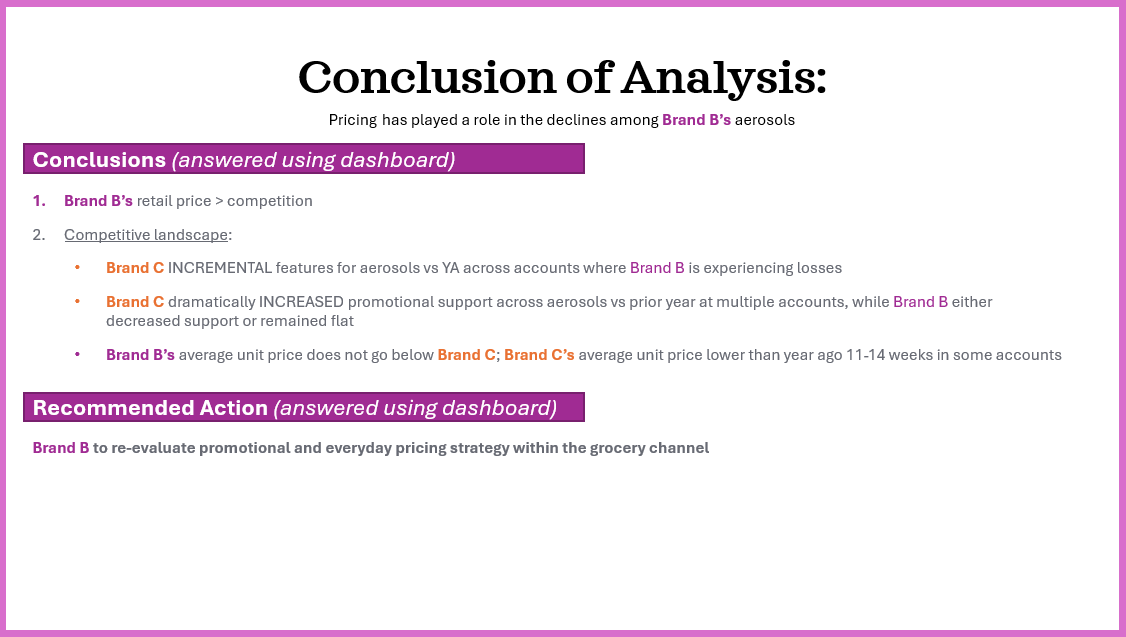
A comprehensive visual representation of sale trends, revealing key market insights and strategic growth opportunities. This enabled informed decision-making and enhanced competitive advantage.
Disclaimer: All showcased data in this portfolio has been anonymized as much as possible to protect company identities, while keep the integrity of the story telling. Some data has been construed to further ensure confidentiality.


